Umami v3.1.0 Self-Hosted Analytics: Let's Take a Look
Table of contents
Update, May 2026. I messed this one up. Someone on the r/selfhosted thread asked whether “no GDPR lawyer required” actually holds up. I dug in. It doesn’t.
Session Replay is the obvious one. It records mouse movement, clicks, scrolls, DOM mutations, and form inputs. Under § 25 TDDDG, that’s not the kind of thing you turn on without consent. So it’s off. Recordings deleted. Won’t come back without a real opt-in flow.
The less obvious one: the standard Umami tracker also reads stuff off the device via JavaScript.
navigator.languageandscreen.width. Not a lot, but enough that the strict reading of § 25 TDDDG catches it. I yanked the default script tag and switched todata-auto-track="false"with a manualumami.track()call that strips both from the payload. What’s left is URL, referrer, user agent and country, all from HTTP headers, none of it read off the device.Whether that’s enough to stay banner-free is genuinely contested. The DSK (Germany’s data protection authorities) tightened its reading of “Zugriff” (access) in November 2024, and recent court rulings have leaned strict. My take is that header-only data isn’t “Zugriff”, so no banner. The privacy policy lays out what’s running and why.
The original passages are below, struck through. Leaving them in because the mistake is the point.
I Still Run My Own Analytics
Google Analytics is a dumpster fire. Cookie banners, GDPR paperwork, a UI that changes every six months, and they sell you out to advertisers by default. I noped out of that years ago.
Umami has been my analytics stack ever since I moved this blog from WordPress to Hugo. Self-hosted, no cookies, one lightweight script, no GDPR lawyer required. It just counts the things I actually care about. Page views. Referrers. What countries people come from. That’s it.
Update: “No GDPR lawyer required” was sloppy. The standard tracker reads
navigator.languageandscreen.widthfrom the browser via JavaScript. Under the DSK’s November 2024 reading of § 25 TDDDG, active JS reads of device properties count as “Zugriff” (access to the end device), which means consent territory. Fix:data-auto-track="false"plus a manualumami.track()call with those two fields stripped. URL, referrer, user agent, country all come from HTTP headers, so they’re fine. That’s the version running now.
And now v3.1.0 is out. This is a big one.
The Changelog, Short Version
- Session Replay - record and play back real user sessions in the browser, built on rrweb
- Boards - drag-and-drop custom dashboards with charts, tables and metric tiles
- Core Web Vitals - real-user LCP, INP, CLS, FCP and TTFB tracking
- Redesigned share pages - proper mobile support, named share links, filtered views
- OR logic and regex in filters - the filter system finally does what you want
- Quality-of-life fixes - PostgreSQL 12/13 compatibility, timezone bugs, mobile UI, Prisma race conditions
Session Replay is the headliner. Web Vitals is the one I actually care about.
The Update Itself Was Boring
Which is exactly what you want.
I run Umami in a Docker container behind Traefik like everything else on my server. Pull the new image tag, docker compose up -d, wait for the Prisma migrations to finish, done. Took maybe two minutes.
One thing to watch out for: v3.1.0 bumps the minimum Node.js version to 22 because Prisma 7 needs it. If you’re building from source you’ll care. If you’re using the Docker image like a normal person, you don’t.
The schema migrations for the new Boards and Session Replay features run automatically on first boot. I checked the logs, saw a bunch of migrating... lines, then nothing scary. No downtime, no manual SQL.
Session Replay Is the Headline Feature
This is the one everyone’s going to talk about. Umami can now record user sessions and play them back in your browser. Mouse movements, clicks, scrolls, the whole thing.
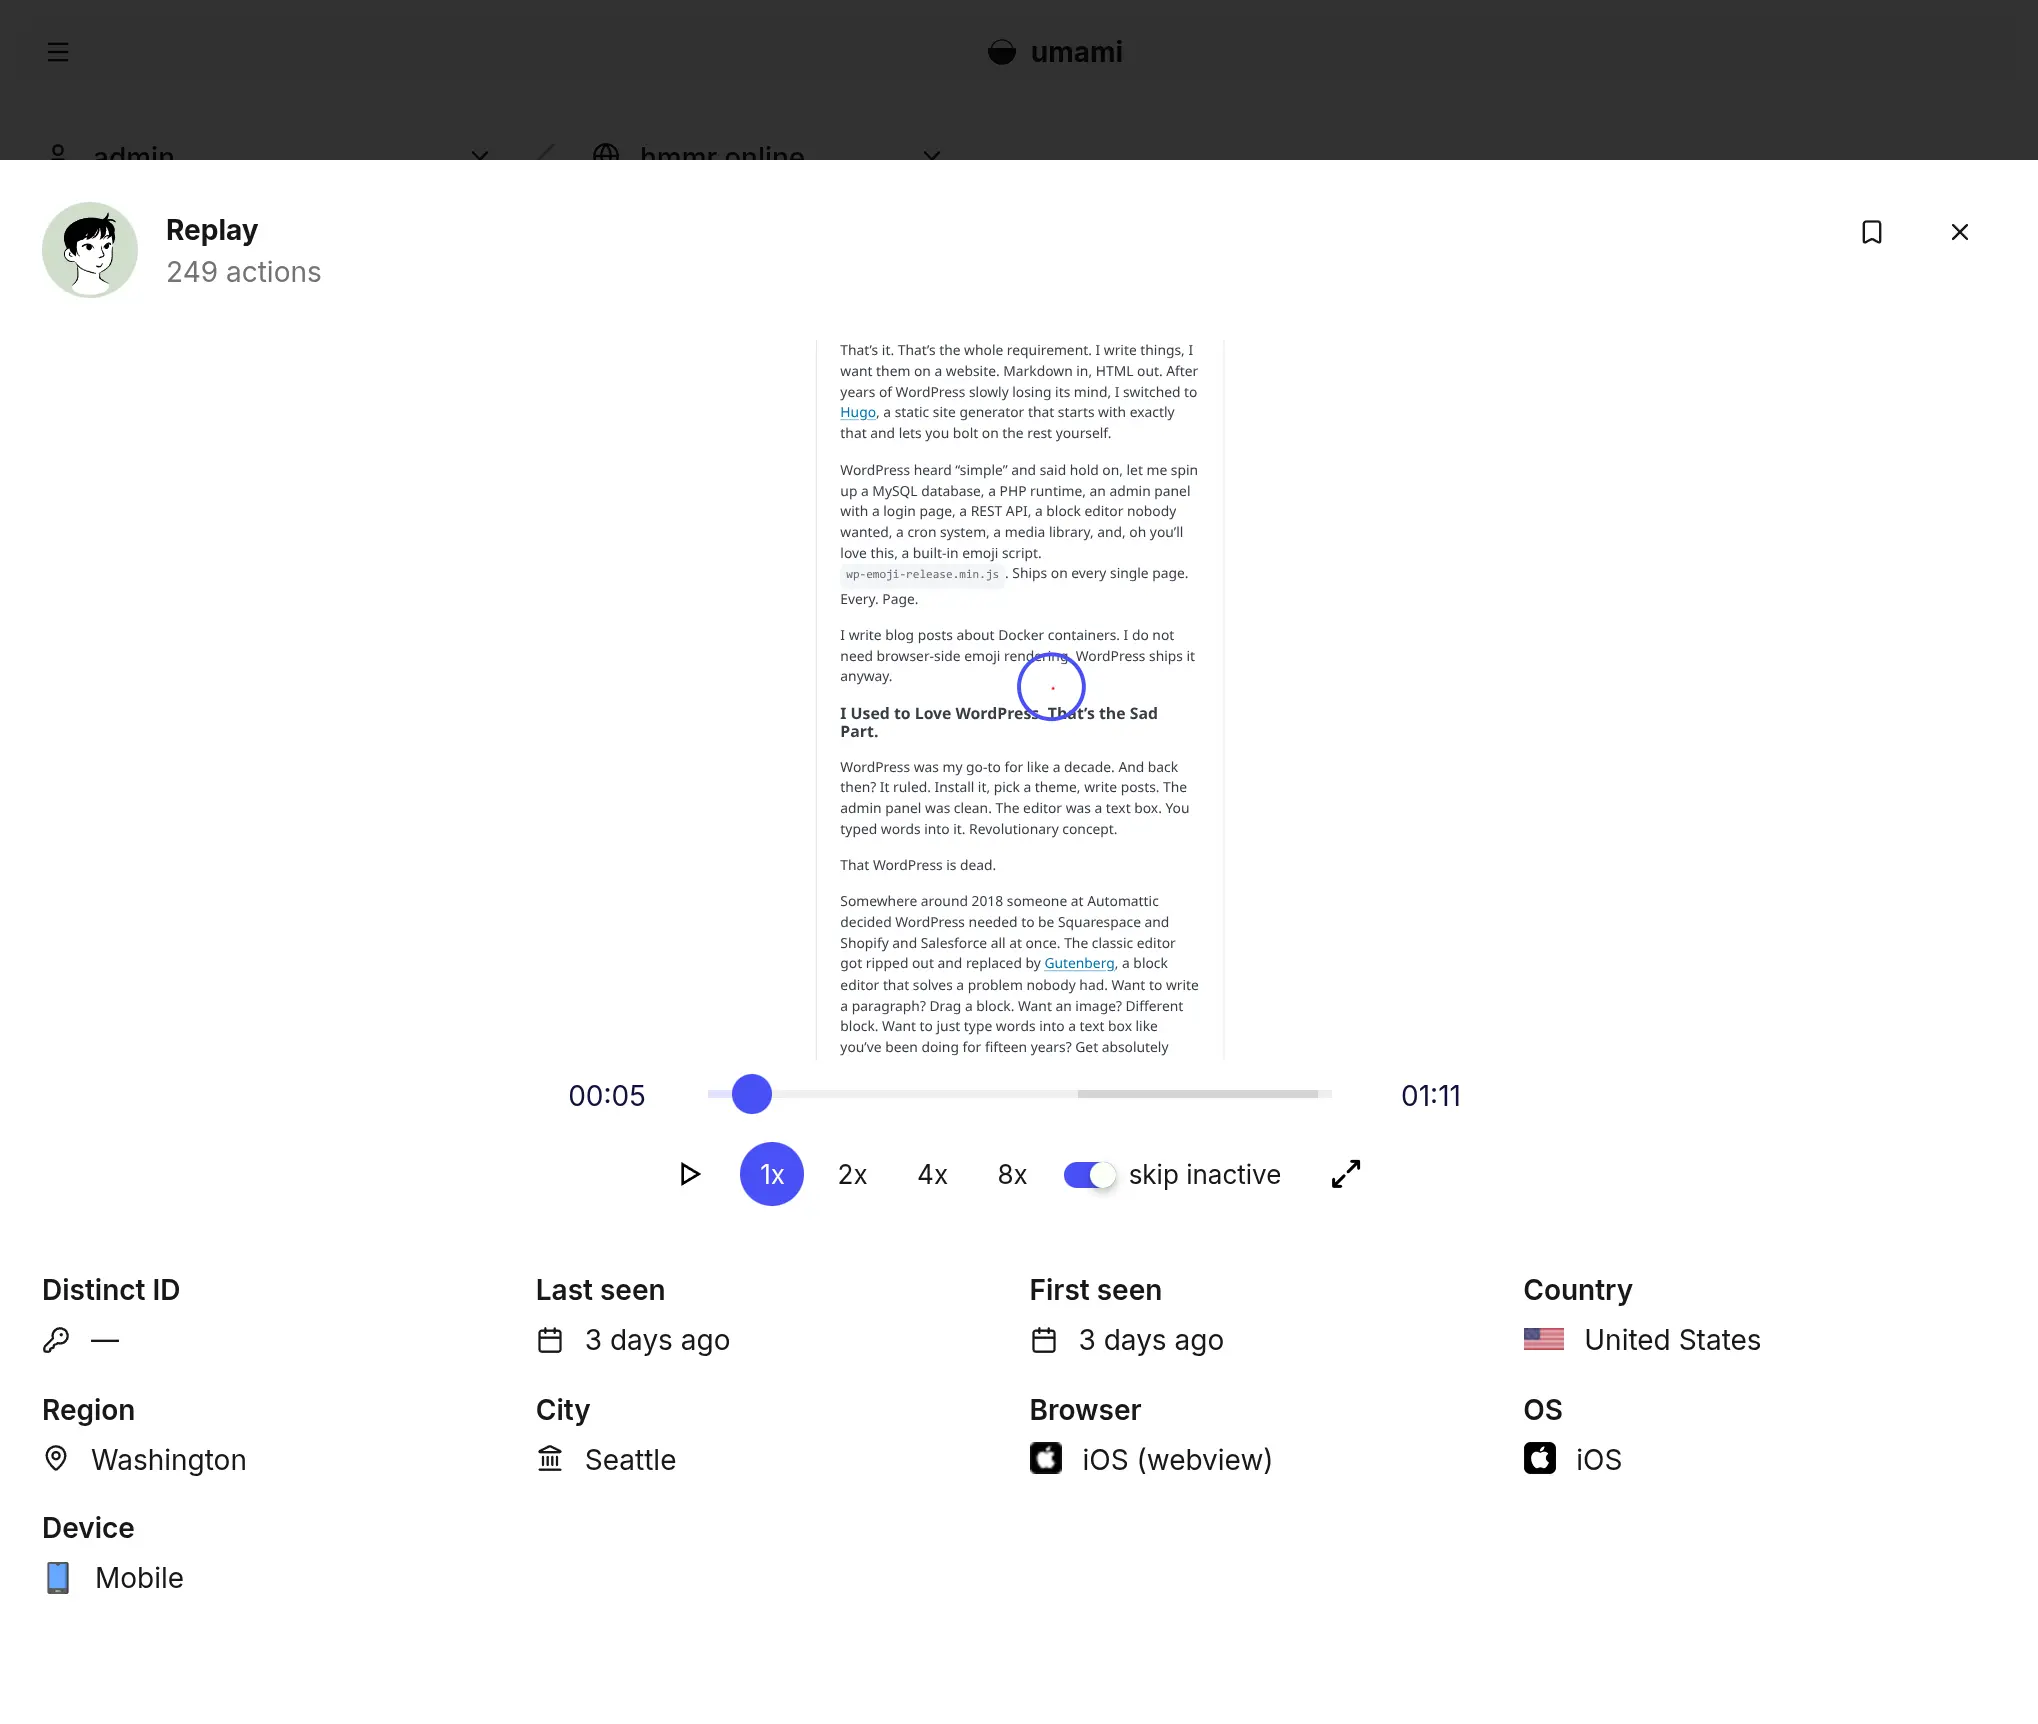
It’s built on rrweb, which is the same library that powers basically every session replay tool out there. Works alongside the existing tracker. You enable it per-website, and it starts recording.
Privacy-wise, they defaulted it to “moderate” masking. Input fields get obscured, sensitive elements are hidden. Which is good, because the whole point of running Umami is to not spy on people. There are stricter and looser levels if you want to tune it.
Update: “Moderate” only masks form inputs. That’s it. Anything your page renders as plain HTML (names, order IDs, a user ID in the URL, a “Welcome back, Alex” header) lands in the replay stream in clear text. Attributes like
alt,title,value,srcaren’t touched either. For a logged-out blog the surface is tiny, but the “we’re not spying on people” framing only really works if Replay is either off or cranked to Strict with.rr-blockand.rr-maskclasses painted onto anything sensitive. The default doesn’t do most of the work for you.
Did I turn it on for this blog? Yeah, and I left it on. Watching someone scroll through my TL;DR section and then leave is weirdly humbling. But it’s also genuinely useful. You see where people bounce, which sections they skim, whether the mobile layout actually works on a weird screen size you never tested on. Stuff that raw pageview numbers don’t tell you.
If you’re running an app or a shop, this is obviously a bigger deal. For a blog it’s more of a curiosity tool. Either way, I’m keeping it on.
Update: Wrong, and “I’m keeping it on” especially. Turning on Session Replay without consent in Germany is just not allowed. § 25 TDDDG settles the question before you ever look at the GDPR balancing test. It demands an opt-in for accessing the visitor’s device, no matter what your legitimate interest looks like. The “strictly necessary” exception that lets shopping carts work without consent doesn’t stretch to analytics. Nobody comes to a blog because they want their scrolling recorded.
So Replay is off. Recordings deleted. It comes back when the recorder script is properly gated behind a consent manager and the privacy policy spells out what it does. Not before.
Boards Are Actually Useful
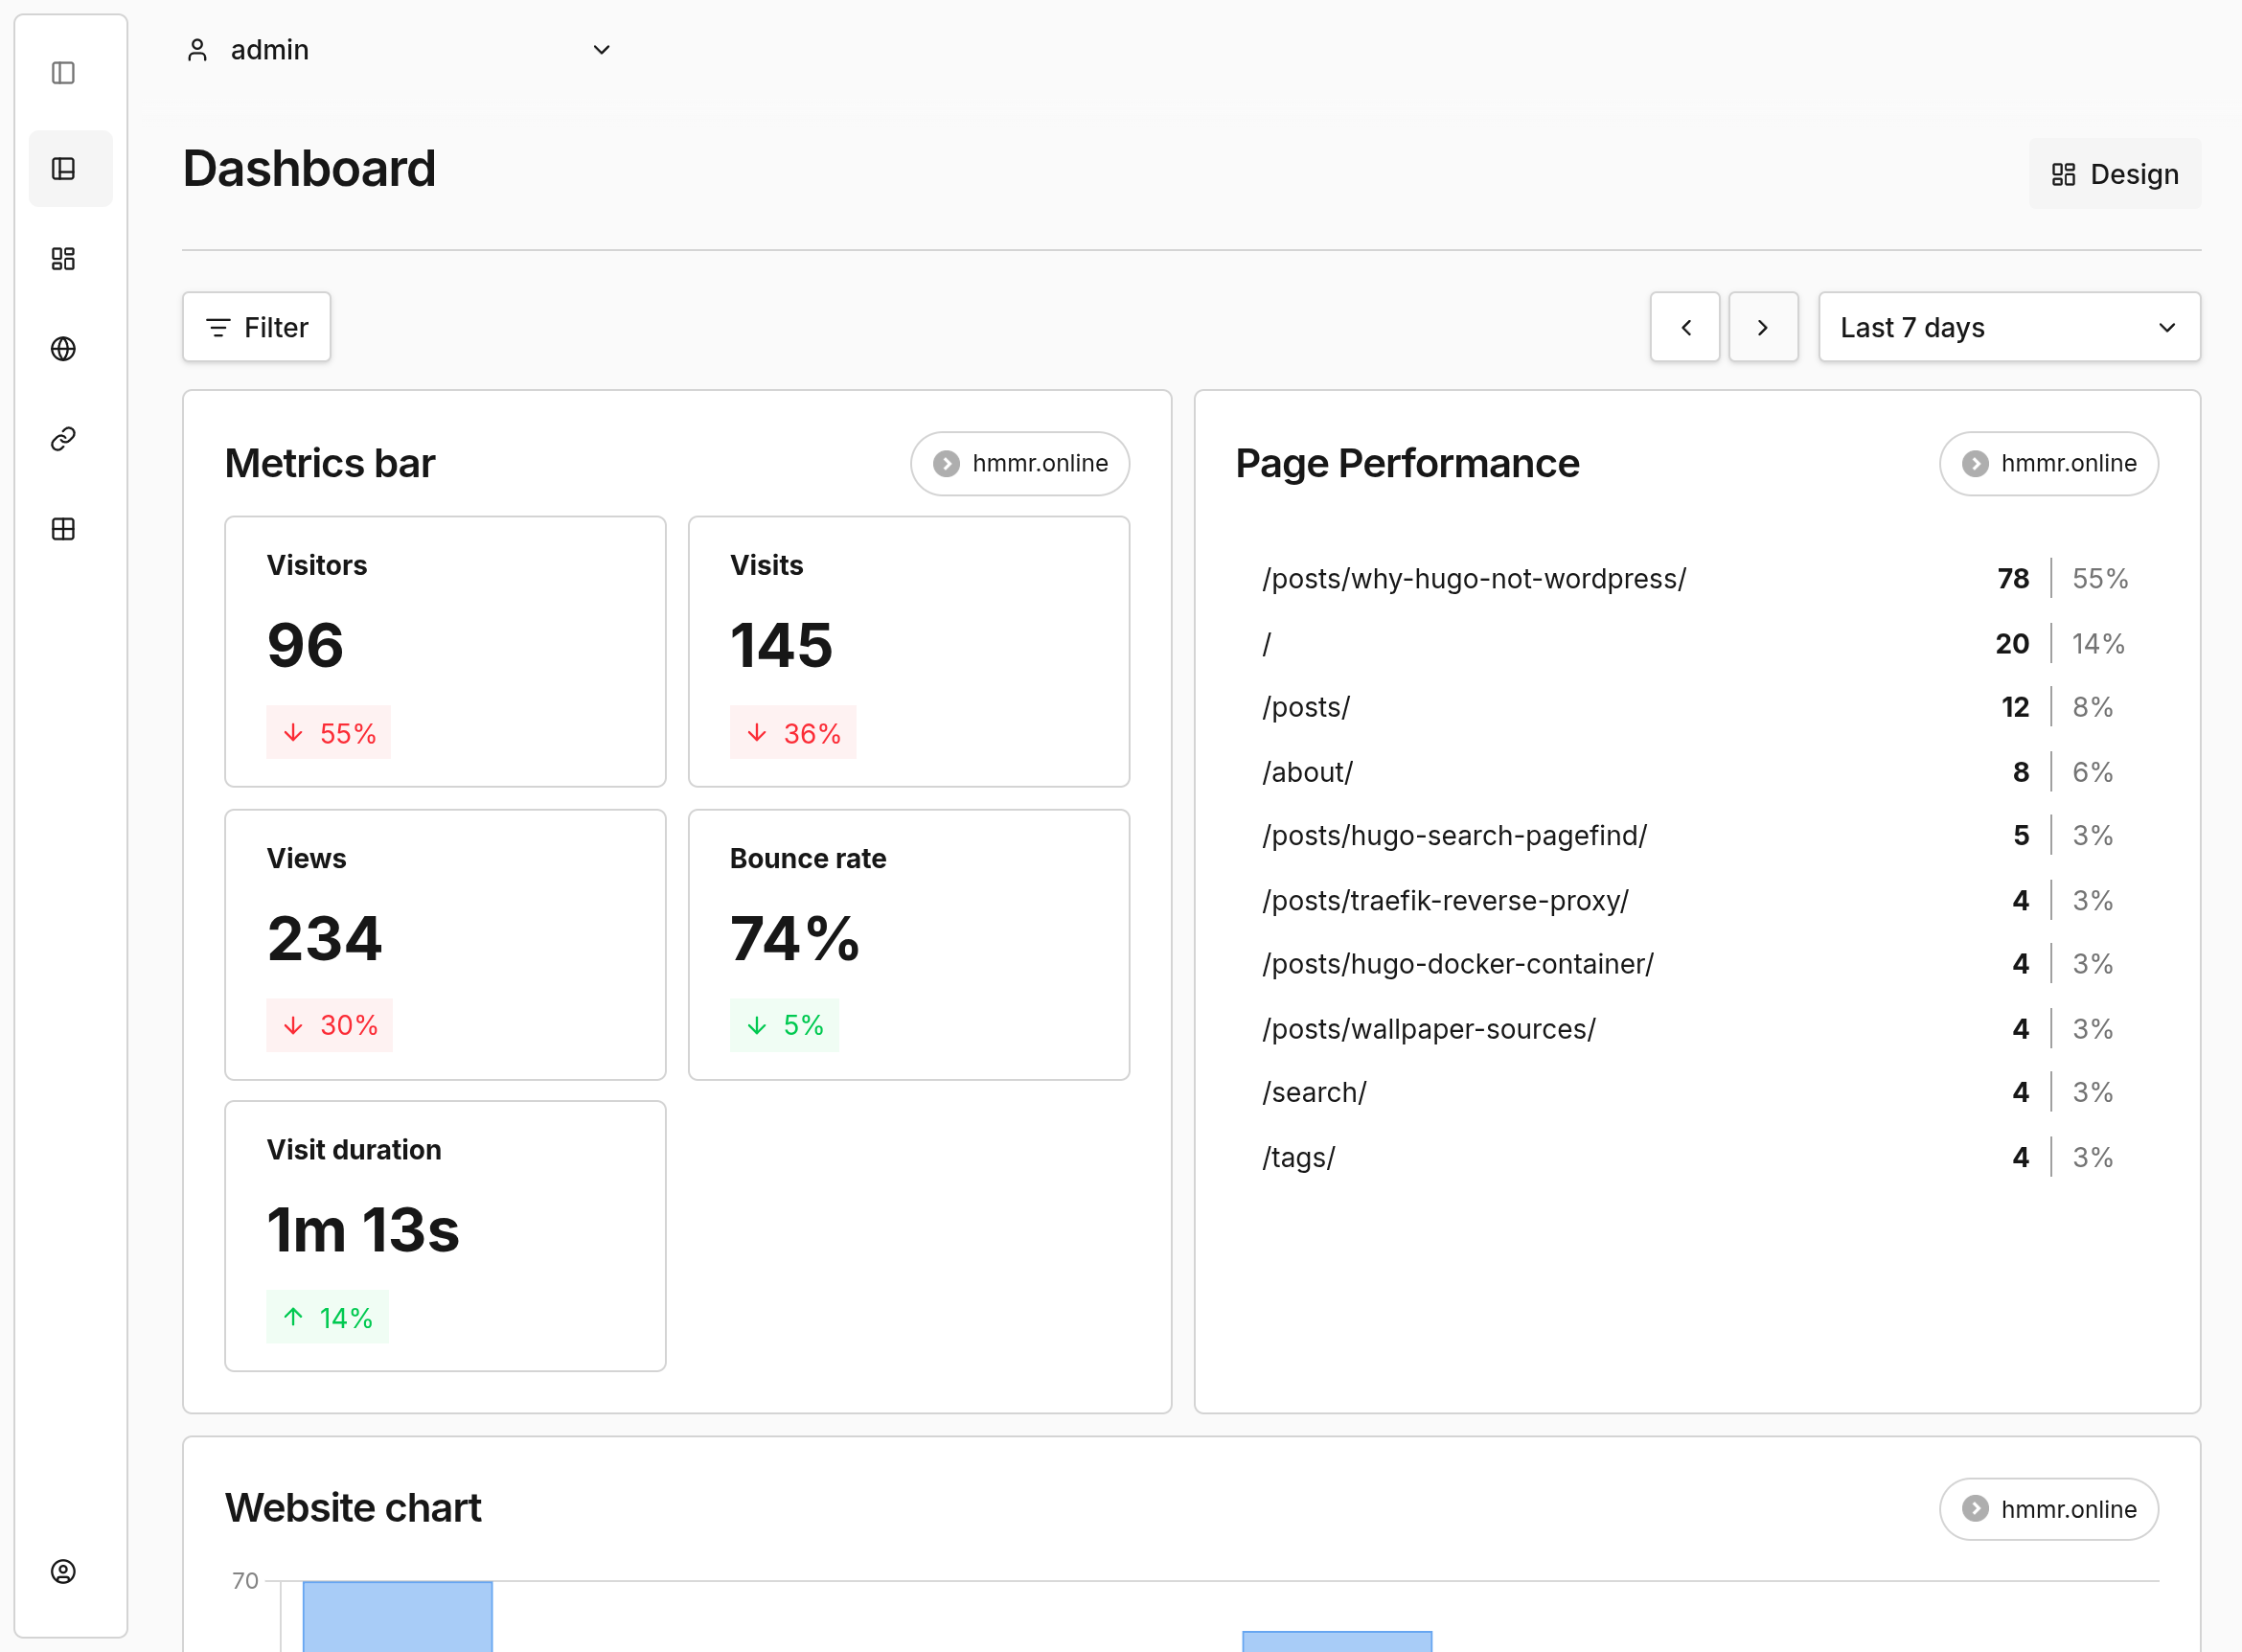
Umami has always had “the dashboard” - views, visitors, referrers, the usual. It’s fine but it’s fixed.
Boards let you build your own. Drag components onto a canvas. Charts, tables, metric tiles. Bind each one to whichever website you want. Add text blocks for notes. Share the whole thing with a link.
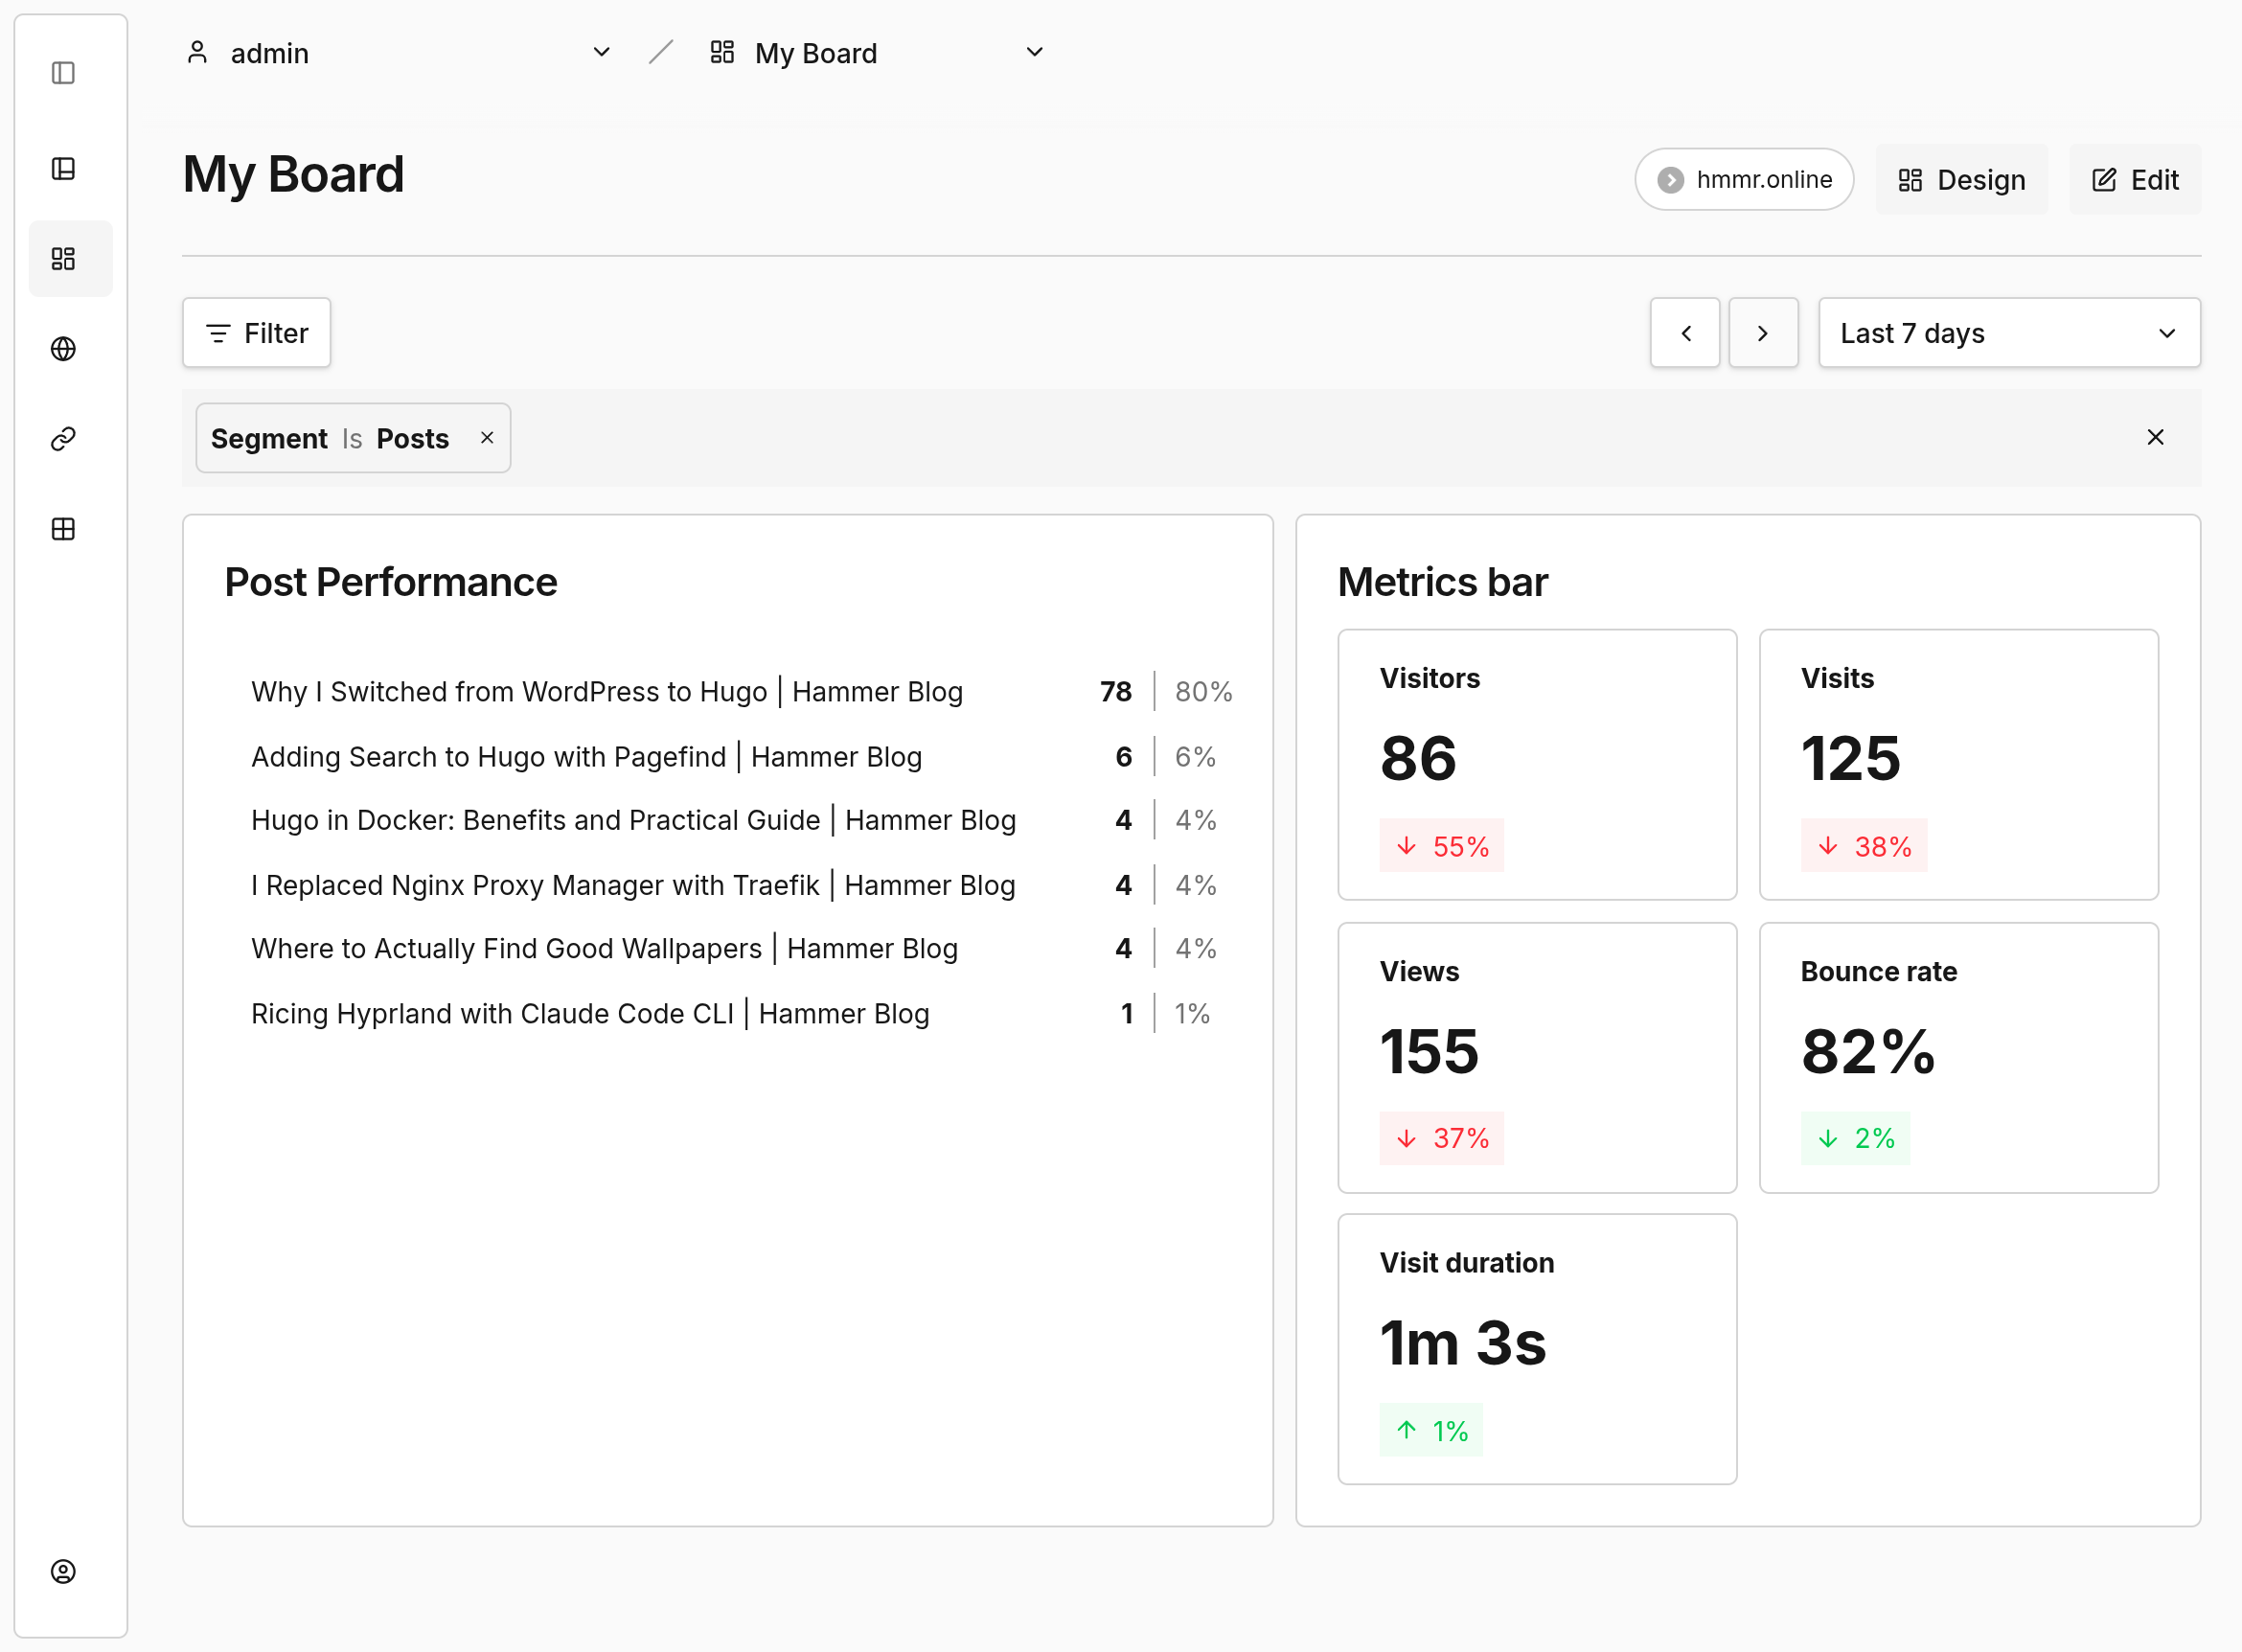
I threw together a board for the blog that’s just the stuff I actually look at. Top pages. Referrers that aren’t bots. Country breakdown. Events for the RSS subscribe button. That’s all I need. The default dashboard has like fifteen other things I scroll past every time.
The cool part: both the default dashboard and the custom boards let you mix data from multiple sites, pixels and links on the same view. Stack a campaign pixel next to the main site, compare two projects side by side, whatever you want. No tab switching.
Am I going to use this? Honestly, no. I have one blog. Comparing hmmr.online to hmmr.online is not exactly a thrill ride. But the feature sits there looking useful, and now I’m weirdly tempted to start a second site just to justify the split view. That’s how you know they built it right.
Web Vitals Almost Tricked Me
This one made me smile.
Umami now tracks Core Web Vitals in the browser. LCP, INP, CLS, FCP, TTFB. All the things Google cares about for SEO. Real data from actual visitors, not synthetic tests from PageSpeed Insights.
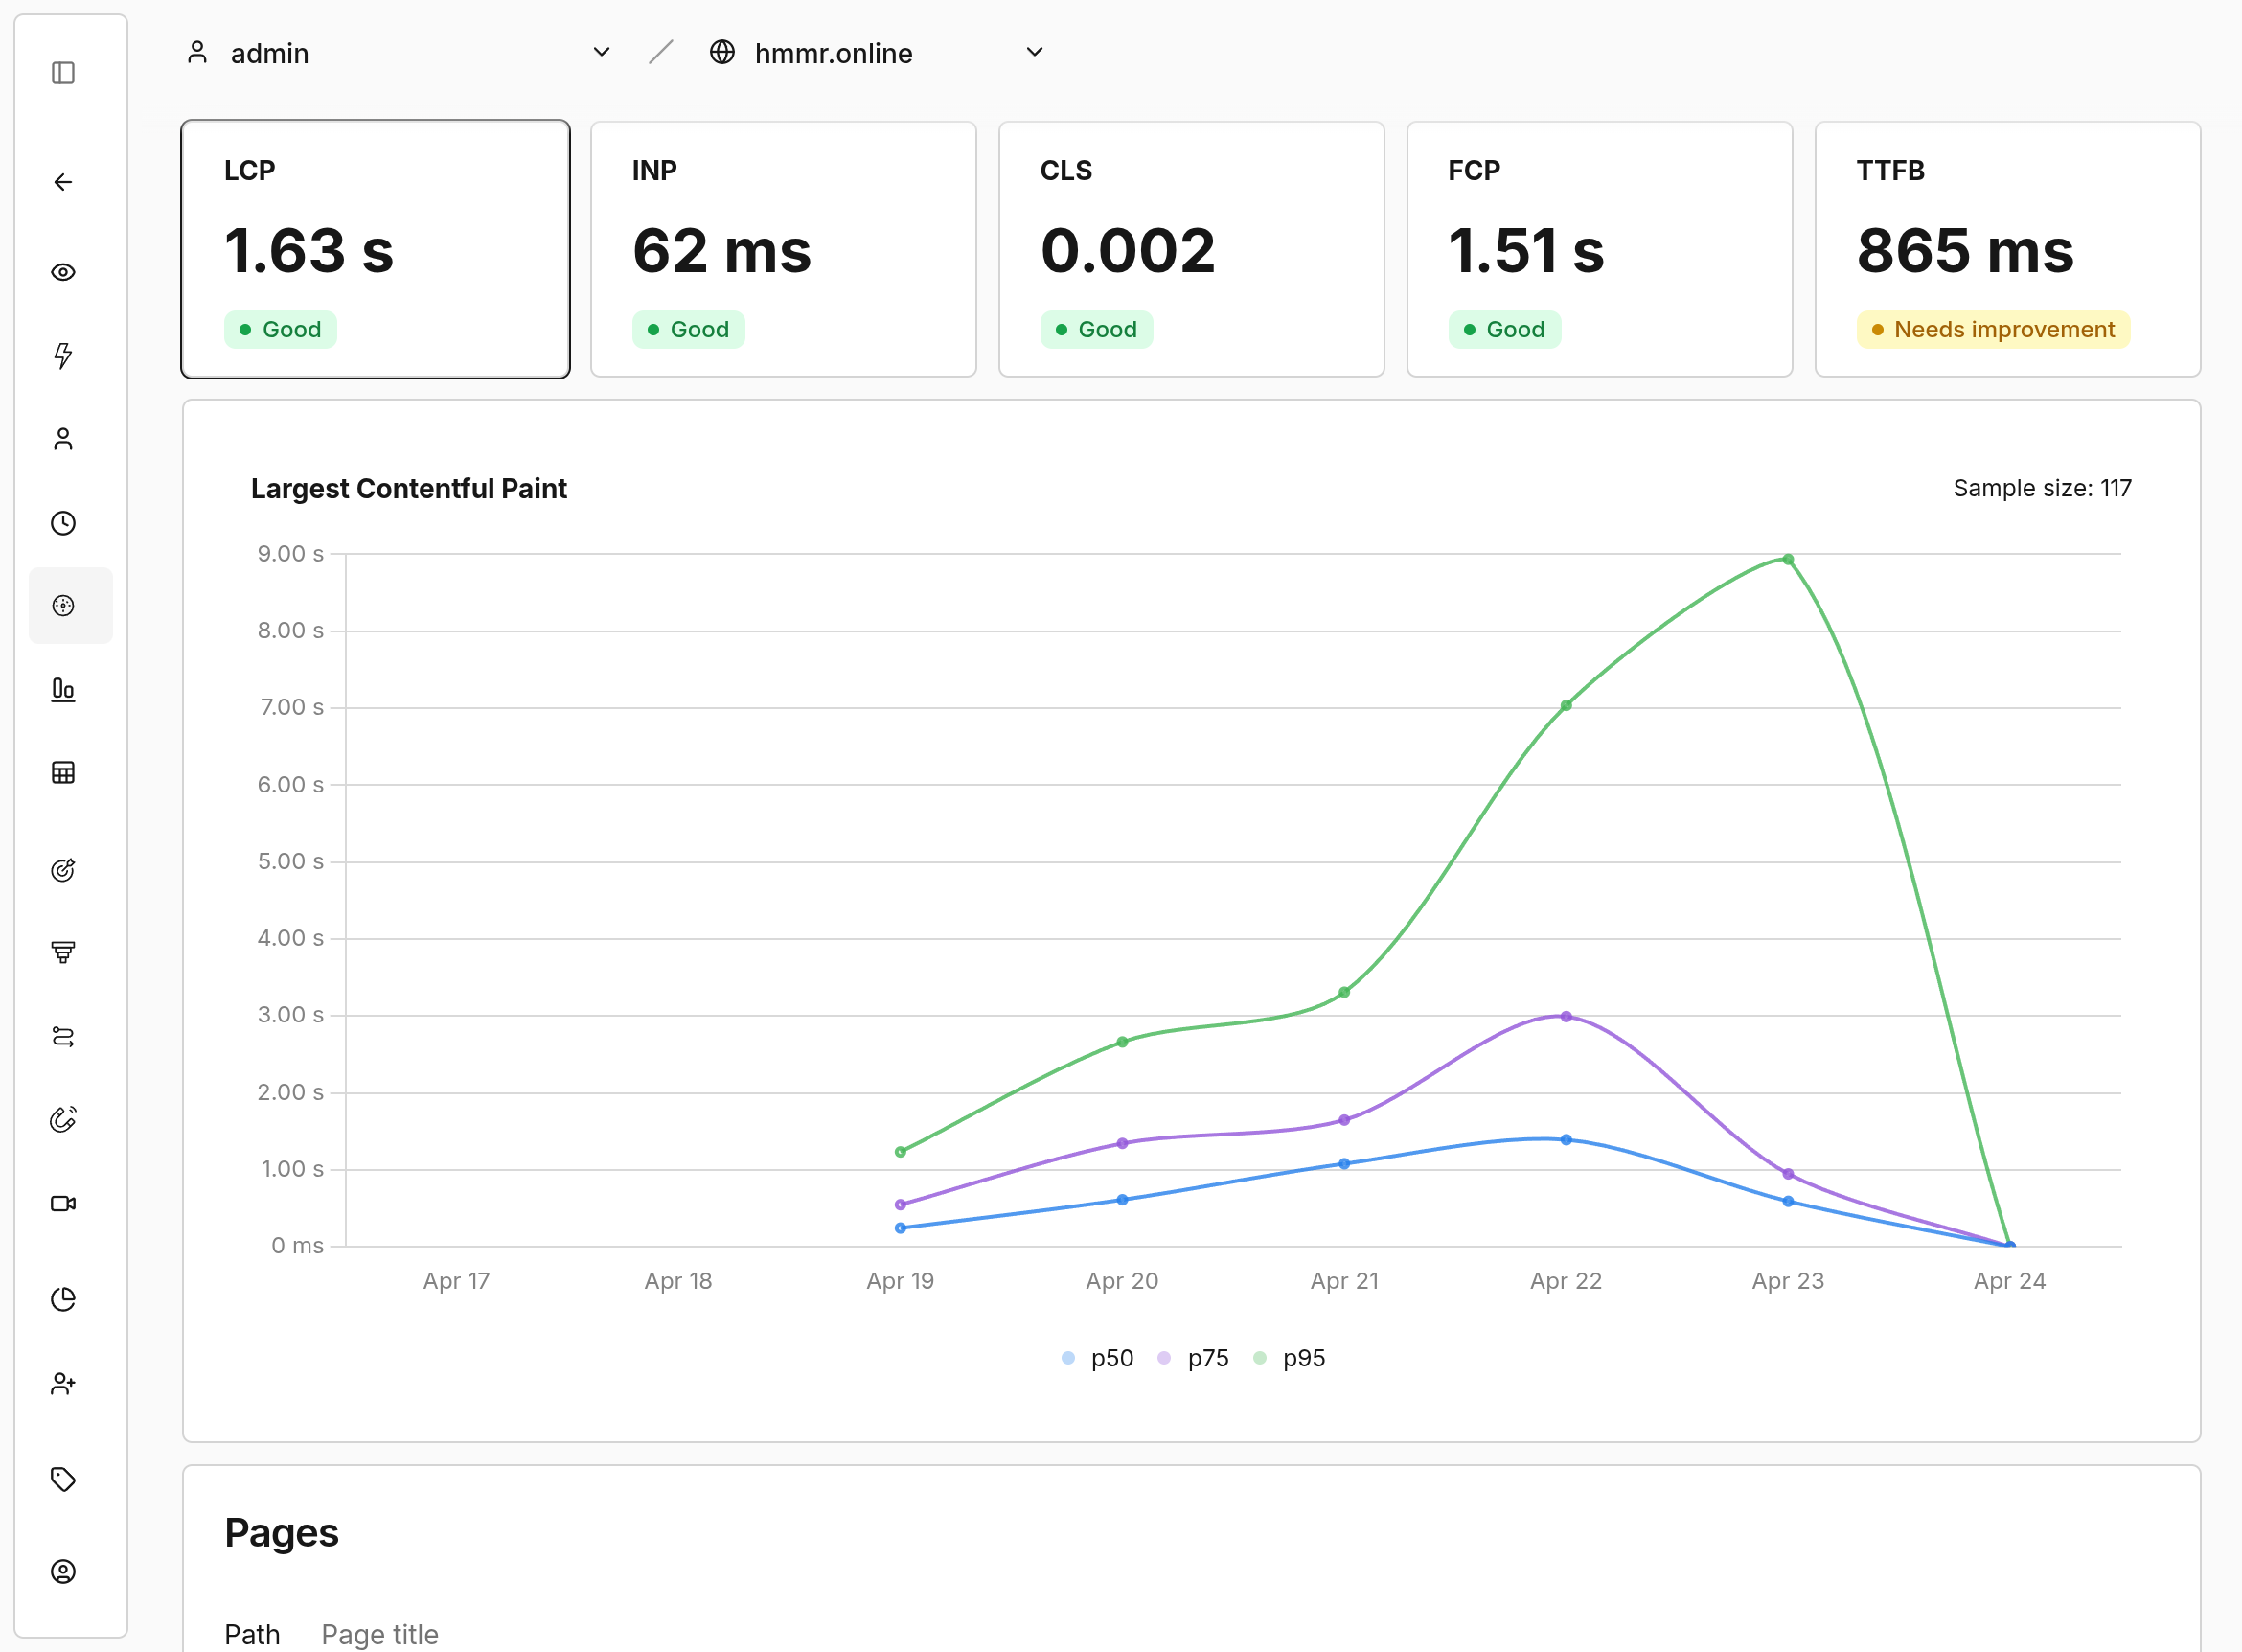
My Lighthouse scores are almost always 100/100, so I was curious whether the real-world numbers would match. Opened the shiny new Performance tab after the upgrade and… nothing. Empty. Zero visitors recorded.
I spent way too long debugging this. Checked the logs, checked the Postgres volume, seriously considered rolling back. Someone else ran into the same wall.
Turns out Web Vitals collection is opt-in. You need data-performance="true" on your tracker script tag. Miss it, and the Performance page just sits there looking sad forever.
<script
  defer
  src="https://stats.yourdomain.com/script.js"
  data-website-id="your-website-id"
  data-performance="true"
></script>
Add the attribute, redeploy, wait for a few visitors to trickle in. Data started flowing within minutes. All green across the board so far, which matches my Lighthouse scores.
And that’s exactly why this feature matters. Right now everything’s fine. But if a future deployment bloats a page, or a third-party script starts misbehaving, or I add an image that tanks LCP on mobile, I’ll see it in the dashboard. Not weeks later in a Search Console email. Real user data catches regressions that synthetic tests miss. That alone is worth the upgrade.
Update: I’ve since turned this off too. Same trap as Replay. Web Vitals hooks into the Performance API to read LCP, INP, CLS, all device-side reads via JavaScript. § 25 TDDDG applies the same way. If you’re outside the EU, ignore this. If you’re inside, leave
data-performanceoff until you’ve got a consent flow that gates it properly.
Everything Else
The release notes are huge. A lot of it is quality-of-life stuff:
- Redesigned share pages - proper mobile support, named links and filtered views. Big step up from the old cramped version if you share your numbers publicly.
- OR logic across filters - you can finally build “referrer is X or Y” queries without hacks
- Regex operators - proper pattern matching in filters
- Custom slugs for Links - their URL shortener feature gets vanity URLs
- Download for breakdown reports - export to CSV without SQL gymnastics
SKIP_BUILD_GEOenv variable - skips the GeoIP database build if you don’t need it, which makes the image smaller- Configurable salt rotation - used to be hardcoded, now you set the period
- Bounce exclusion toggle - finally
Also a pile of bug fixes. PostgreSQL 12/13 compatibility issues, timezone bugs in relational queries, mobile UI fixes, session race conditions in Prisma. The kind of stuff that was probably annoying specific people a lot and nobody else at all. If any of those were biting you, they’re fixed now.
The Downsides
Firefox gets the read-only tour. Viewing boards works fine, but the edit screen just… doesn’t load. Blank canvas, no toolbar, nothing. Like the page is quietly judging you for not using Chrome.
So you design the board somewhere else, switch back to Firefox, admire your work, switch away again to change anything. Silly little dance. A fix is already merged on GitHub, just not in a release yet, so this sorts itself out on the next point version.
Session Replay adds weight to the tracker script. Not a lot, but more than zero. If you’re obsessive about page speed, check your Lighthouse scores after enabling it.
The migrations felt slightly scary. Lots of schema changes at once: Boards, Shares, Session Replay. Did I back up my Postgres volume first? No. I yolo’d it. Worked fine. You should still run a pg_dump before upgrading. Way less painful than losing a year of stats because a migration went sideways.
Would I Install Umami Fresh Today?
Yeah, absolutely. If you’re self-hosting anything already - running Hugo in Docker, managing your own containers, fighting with reverse proxies - Umami fits right in. One more docker-compose.yml entry. Works alongside everything else.
If you’re on managed hosting and don’t want to mess with containers, Umami offers a hosted Cloud plan. That’s fine too. The software is open source either way.
The alternative is Google counting your visitors for you. Hard pass. If you already built the site yourself and wired up your own search, owning the analytics is the obvious next step. Same stack, no cookie banner, no ad tech sitting in the middle.
TL;DR
Session Replay, custom Boards, real-user Web Vitals. The update was boring in the good way. Turn on data-performance="true" or the Web Vitals page just sits there empty and you waste an afternoon wondering why.
If you’re in the EU: Session Replay and Web Vitals need a consent flow before you turn them on. Both read from the visitor’s device via JS, which kills the no-banner-needed argument. Check your base tracker too: the standard script reads navigator.language and screen.width the same way. Fix is data-auto-track="false" plus a manual umami.track() call with those two stripped. Boards, filters, the share page redesign: fine as is.
This post is part of the Docker topic hub. Explore all Docker guides →
This post is part of the Self-Hosting topic hub. Explore all Self-Hosting guides →
Written by
Alexander Hammer
Software developer. Arch Linux. Self-hosted everything.
Popular Posts
- #1
- #2
-
#3
Why I Switched from WordPress to Hugo
525 views · Read -
#4
Why I Switched from Hugo to Astro
415 views · Read -
#5
Ricing Hyprland with Claude Code CLI
137 views · Read